

Updated 27 Apr 2026 • 8 mins read
Cloud Cost Allocation: An Engineering-First Guide to Visibility, Accountability & Optimization
Cloud cost allocation maps spend to teams or products, improving visibility and accountability. Mature practices raise coverage from about 60% to over 95%, reducing hidden waste. Showback and chargeback define accountability levels. Strong tagging, automation, and policy enforcement are essential. Without this discipline, organizations can lose 20–32% of spend, while modern platforms streamline insights rapidly.
Introduction
When we look back at the last decade of cloud adoption, one pattern repeats itself across nearly every engineering organization we have worked with: the bill grows faster than the visibility into it. Teams provision resources at velocity, services multiply, and within months, finance leaders are staring at multi-million-dollar invoices with no clear answer to a deceptively simple question: who actually owns what? That gap between spending and ownership is exactly what cloud cost allocation is designed to close.
In this guide, we share what we have learned from working alongside engineering teams that operate at serious scale, clusters with thousands of nodes, data lakes pushing past the petabyte mark, and inference pipelines that consume tens of thousands of GPU-hours every month. The principles that follow apply whether we are running a 50-engineer startup in Bengaluru or a global enterprise spread across three continents. The numbers change; the discipline does not.
What Cloud Cost Allocation Really Means in a Modern Environment
At its core, cloud cost allocation is the process of attributing every line item on a cloud invoice, compute, storage, networking, managed services, AI, and ML inference, to the entity that consumed it. That entity might be a product line, an engineering team, a customer, or a feature rolled out in a single region. The exercise sounds straightforward, yet at scale it becomes one of the hardest data-engineering problems an organization will face.
The reason it matters becomes obvious the moment we look at the numbers. Industry benchmarks consistently show that 28–32% of cloud spend in mid-to-large enterprises remains directly unattributable to a business owner. On a $20M annual cloud commitment, that is roughly $5.6M to $6.4M flowing into a black box every year. Effective cloud cost allocation is the mechanism that drains this black box.
In practice, allocation operates across three layers. The first is direct costs, a dedicated GPU node serving Service A, or a managed database powering a single product. The second is shared costs, a transit gateway used by twelve teams, or a Kubernetes cluster hosting forty microservices. The third is platform overhead, premium support, observability bills, and security tooling. A genuinely mature allocation strategy handles all three; a brittle one handles only the easy first layer and lets the rest pile up in an unallocated bucket.
Why Cloud Cost Allocation Matters at Engineering Scale
When we work with engineering teams running 1,000+ microservices across multiple Kubernetes clusters and processing several billion API requests per day, the cost of poor allocation is not just financial; it is organizational. Without clear ownership, optimization conversations stall, capacity planning becomes guesswork, and engineering velocity erodes under the weight of repeated finance escalations.
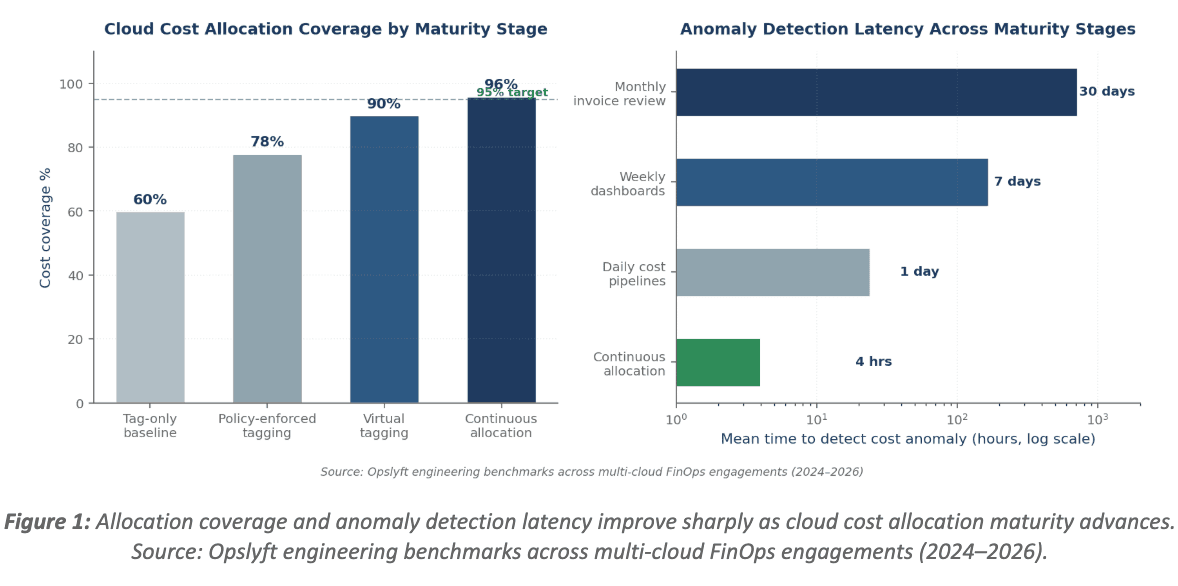
Here is the quantified delta we have repeatedly observed when allocation maturity improves from baseline (tag-only, monthly review) to optimized (virtual tagging plus continuous pipelines):
- Cost coverage climbs from roughly 60% to 95% or higher.
- Time-to-detect cost anomalies drops from a 14–30 day invoice cycle to under 24 hours.
- Engineering-led optimization wins rise by 2–3x once teams can see the cost of services they actually own.
Shared-cost disputes drop by 70%+ when allocation logic is documented and queryable.
For engineering organizations in fast-growing tech hubs like Bengaluru, where headcount frequently doubles in 18 months and cloud spend can triple in the same window, establishing allocation discipline early is the difference between predictable cloud economics and a runaway bill at the next funding round. We have seen the same pattern in São Paulo, Berlin, and Austin: the cost trajectory after Series B is set largely by the allocation discipline put in place during Series A.
The downstream business impact is significant. Faster experimentation cycles, more accurate unit economics, cleaner gross margins on SaaS products, and tighter alignment between engineering decisions and finance reporting all flow from allocation done well. For a deeper look at why this connects directly to organizational health, the FinOps practices guide walks through the maturity stages we typically see.
The Core Methods We Use for Cloud Cost Allocation
Allocation is a multi-method discipline. No single technique covers every scenario, so the mature organizations we work with layer approaches rather than relying on one.
Tagging: The Foundation
Tagging assigns metadata such as project, owner, environment, and cost-center to every resource. When enforced consistently, tagging is the cleanest way to slice spend. The challenge is that tag drift is inevitable at scale: in our experience, untagged resources accumulate at roughly 8–12% per quarter without active enforcement. We strongly recommend reviewing the comprehensive guide to tagging strategies in cloud cost allocation alongside the practical breakdown of 5 cloud tagging best practices. For provider-specific implementations, the AWS tagging strategy guide and the Azure tagging guide cover the nuances we see most often.
Native Cloud Cost Tools
AWS Cost Explorer, Azure Cost Management, and GCP Billing Reports each offer foundational allocation views. They are free, deeply integrated, and a reasonable starting point. The trade-off is that they are single-cloud and limit how flexibly we can model shared costs. For multi-cloud or Kubernetes-heavy environments, native tools alone leave material gaps in visibility.
Automation and Virtual Tagging
When physical tagging falls short, and it always will at some point, virtual tagging fills the gap. Virtual tags are allocation rules applied on top of cost data, matching resources by naming convention, account, region, or any combination of metadata, without modifying the underlying infrastructure. The advantage is speed and historical reach: we can backfill allocation for years of data in minutes rather than launching a multi-quarter retag-everything project that engineering teams will rightly resist.
Showback and Chargeback Models
These are the financial discipline layers built on top of the allocation data. Showback reports usage to teams without billing them; chargeback actually moves the cost onto the team's profit-and-loss statement. We will examine the trade-off between the two next.
Showback vs Chargeback: A Real Architectural Trade-off
Choosing between showback and chargeback is one of the most consequential decisions in any cloud cost allocation program. Both approaches solve different problems, and we have seen organizations get burned by jumping straight to chargeback before the underlying data was trustworthy. The trade-off is not just financial, it is cultural and operational.
| Dimension | Showback | Chargeback |
|---|---|---|
| Behavior change speed | Slower; awareness-driven | Faster; financial pressure drives action |
| Required allocation accuracy | ~85% allocated coverage is acceptable | 95%+ coverage essential to avoid disputes |
| Engineering friction | Low, no real-money impact | Higher initially; needs strong communication |
| Forecasting precision | Improves gradually | Improves immediately as teams' own forecasts |
| Risk if the data is wrong | Misinformation; reputational | Inter-team conflict, finance escalation |
| Best for | Organizations starting their FinOps journey | Mature FinOps practice with reliable tagging |
Our recommendation, validated across dozens of engagements: start with showback for two to three quarters, validate that allocation is reliably above 90%, and then graduate to chargeback for the teams that are ready to own their own P&L. This staged approach reduces failure risk dramatically and builds organizational trust in the underlying allocation data, which is what really determines whether chargeback succeeds or fails.
Failure Modes We Have Encountered (and Mitigations That Work)
Cloud cost allocation systems fail in predictable ways at scale. Mapping the failure surface in advance is half the battle. Here are the five we see most often, paired with the mitigations and the measurable impact each one delivers.
1. Tag Drift and the Untagged Bucket
Symptom: a steadily growing untagged bucket, frequently 15–25% of total spend after six months without enforcement. Mitigation: enforce tagging at provisioning time using AWS Service Control Policies, Azure Policy, or Terraform pre-commit hooks, and pair this with quarterly tag audits. In environments where we have implemented this, the untagged bucket typically drops below 5% within one quarter.
2. Kubernetes Cost Obscurity
Symptom: a multi-tenant cluster shows up as a single billing line item, hiding which team consumed what compute, memory, or persistent storage. Mitigation: namespace and label-based allocation combined with shared infrastructure splitting by CPU and memory usage. Without this, Kubernetes can quietly inflate cloud spend by 30–50% over twelve months, with no clear owner to address it.
3. Allocation Logic Drift in Multi-Cloud Setups
Symptom: different allocation rules in AWS versus Azure produce conflicting reports, and finance teams lose trust in the data. Mitigation: centralize allocation logic in a unified FinOps platform and treat allocation rules as code, version-controlled, peer-reviewed, and tested. Trust in the numbers is the single most important currency a FinOps team has..
4. Slow Anomaly Detection
Symptom: a misconfigured resource, say, a forgotten p4d.24xlarge instance or a runaway data egress pipeline, burns $40,000 before anyone notices on the next monthly invoice. Mitigation: continuous allocation pipelines combined with automated anomaly detection reduce mean detection latency from approximately 30 days to under 24 hours. The cloud cost forecasting guide for beginners walks through how forecasting and anomaly detection fit together.
5. Chargeback Backlash
Symptom: engineering teams hide spending in shared services, push back against allocation decisions, or quietly route around the system. Mitigation: transparency. Publish allocation logic openly, give teams self-service drill-down dashboards, and back the rollout with strong investment in building a cost-conscious FinOps culture. Cultural change is what makes chargeback stick, not the dashboards.
Best Practices We Have Validated at Scale
Across the engineering teams we have helped, the following practices consistently move the needle on cloud cost allocation. None is theoretical; each one comes with a measurable impact we have seen repeated.
- Define allocation primitives early. Decide whether allocation flows by team, product, or customer, and stick with it across all reporting. Switching primitives mid-flight is the single biggest reliability killer in allocation systems.
- Treat tagging as code. Enforce required tags at the infrastructure-as-code layer (Terraform modules, CloudFormation templates), so untagged resources cannot be created in the first place.
- Layer virtual tagging on top of physical tags. Even with strong discipline, ~5–10% of resources will slip through; virtual tags catch them without forcing engineering retag work.
- Allocate shared costs proportionally. Even-split allocation feels fair but disproportionately penalizes small teams; usage-weighted allocation reflects reality and reduces dispute volume by roughly 70%.
- Review allocation accuracy monthly. A 30-minute monthly audit prevents the quarter-end surprises that erode trust between finance and engineering.
Connect allocation to forecasting and KPIs. Once allocation is reliable, the same data feeds forecasting, unit economics, and the FinOps KPIs that drive cloud cost management.
How Opslyft Performs the Allocation Step
We will mention this contextually, since allocation is a problem we have spent years engineering against. At Opslyft, the allocation engine is built specifically to handle the failure modes laid out above. By combining native tag ingestion, rule-based virtual tagging, Kubernetes-native cost splitting, and continuous anomaly detection in a single platform, Opslyft typically takes organizations from roughly 60% allocation coverage to 95% or higher within the first 30 days of onboarding.
What makes the allocation experience different in practice:
- Unified multi-cloud allocation across AWS, Azure, and GCP with consistent rule logic, no more reconciling three different sources of truth.
- Container-level Kubernetes allocation so shared clusters no longer hide costs from the teams accountable for them.
- Customizable showback and chargeback dashboards for finance, engineering, and leadership, each with the appropriate level of granularity.
- Continuous allocation pipelines that update hourly rather than monthly, cutting anomaly detection latency from weeks to hours.
For teams weighing whether to invest in a dedicated allocation tool versus building it in-house, the build vs buy guide for cloud cost management tools lays out the engineering economics clearly. In our experience, the in-house path takes 9–18 months to reach parity and continues to absorb dedicated headcount indefinitely.
Conclusion
Cloud cost allocation is no longer a finance-only concern; it is an engineering discipline that determines whether cloud spend scales linearly with business value or balloons quietly into waste. The organizations we see succeed treat allocation as a first-class architectural concern: enforced at provisioning, validated continuously, and linked directly to engineering decision-making.
If we had to distill this guide into three actions, they would be these. First, enforce tagging at the infrastructure-as-code layer, so untagged resources never reach production. Second, layer virtual tagging on top to catch the inevitable gaps without dragging engineering into manual cleanup. Third, choose between showback and chargeback based on the maturity of your allocation data, not corporate ambition or a quarterly OKR. Done well, cloud cost allocation lifts coverage to 95%+, cuts anomaly detection from weeks to hours, and turns cloud spend into something every team can own and improve.
For engineering leaders ready to move from manual tagging chaos to automated, accurate, multi-cloud allocation, Opslyft offers a path that compresses months of in-house work into days, while keeping the engineering teams fully in control of the data that defines their cloud footprint.
FAQs
Cloud cost allocation is the process of mapping each dollar spent on cloud services to the team, project, product, or customer responsible for it. It transforms a single opaque cloud bill into a transparent breakdown that engineering and finance can both act on with confidence.
Allocation answers the question, “Who spent what?” Optimization answers, “How do we spend less?” Allocation comes first; it is nearly impossible to optimize what we cannot attribute. Once allocation is mature, proven cloud cost optimization strategies become far more targeted and measurably more effective.
Showback reports cloud costs to teams for visibility without actually billing them. Chargeback transfers the cost onto the team's budget. Showback drives awareness; chargeback drives behavior change. Most organizations use showback first, then graduate to chargeback once allocation accuracy is consistently above 90%.
Even with strong policies, untagged or mis-tagged resources accumulate at 8–12% per quarter due to drift, inherited resources from acquisitions, manual provisioning, and migrations. This is precisely why mature programs combine policy-enforced tagging with virtual tagging and ongoing audits; relying on a single layer always breaks down at scale.
A basic showback model can be operational in two to four weeks. Full enterprise-grade allocation, including chargeback, Kubernetes splits, and multi-cloud reconciliation, typically takes three to six months when done in stages. Platforms like Opslyft compress this timeline significantly by handling the data engineering and rule infrastructure out of the box.
Yes, but it requires container-level allocation. A single Kubernetes cluster shared by multiple teams will appear as one cost line by default, hiding 30–50% of consumption from the teams accountable for it. Label-based allocation, namespace tagging, and shared infrastructure splitting are essential to surface real per-team costs.